I served as a teaching assistant for ST3131 in AY25/26 Semester 2. While going through the course with students, I received many thoughtful questions, and I decided to organize some of them here as supplementary notes and slides.
Please note that these are NOT the official materials for the current offering of the course. If you rely on any of the material here, please do so at your own discretion. For official guidance, always refer to your course instructor and the current Canvas page.
Linear Regression Basics
If you are confused by how $\hat{\beta}$, $\mathrm{se}(\hat{\beta})$, the t-value, or confidence intervals are computed in R, the following references may be helpful:
- This SLR table for simple linear regression. It also includes a summary of ANOVA.
- This MLR table for multiple linear regression. It also includes a summary of ANOVA.
Tutorial 3: Some Extensions
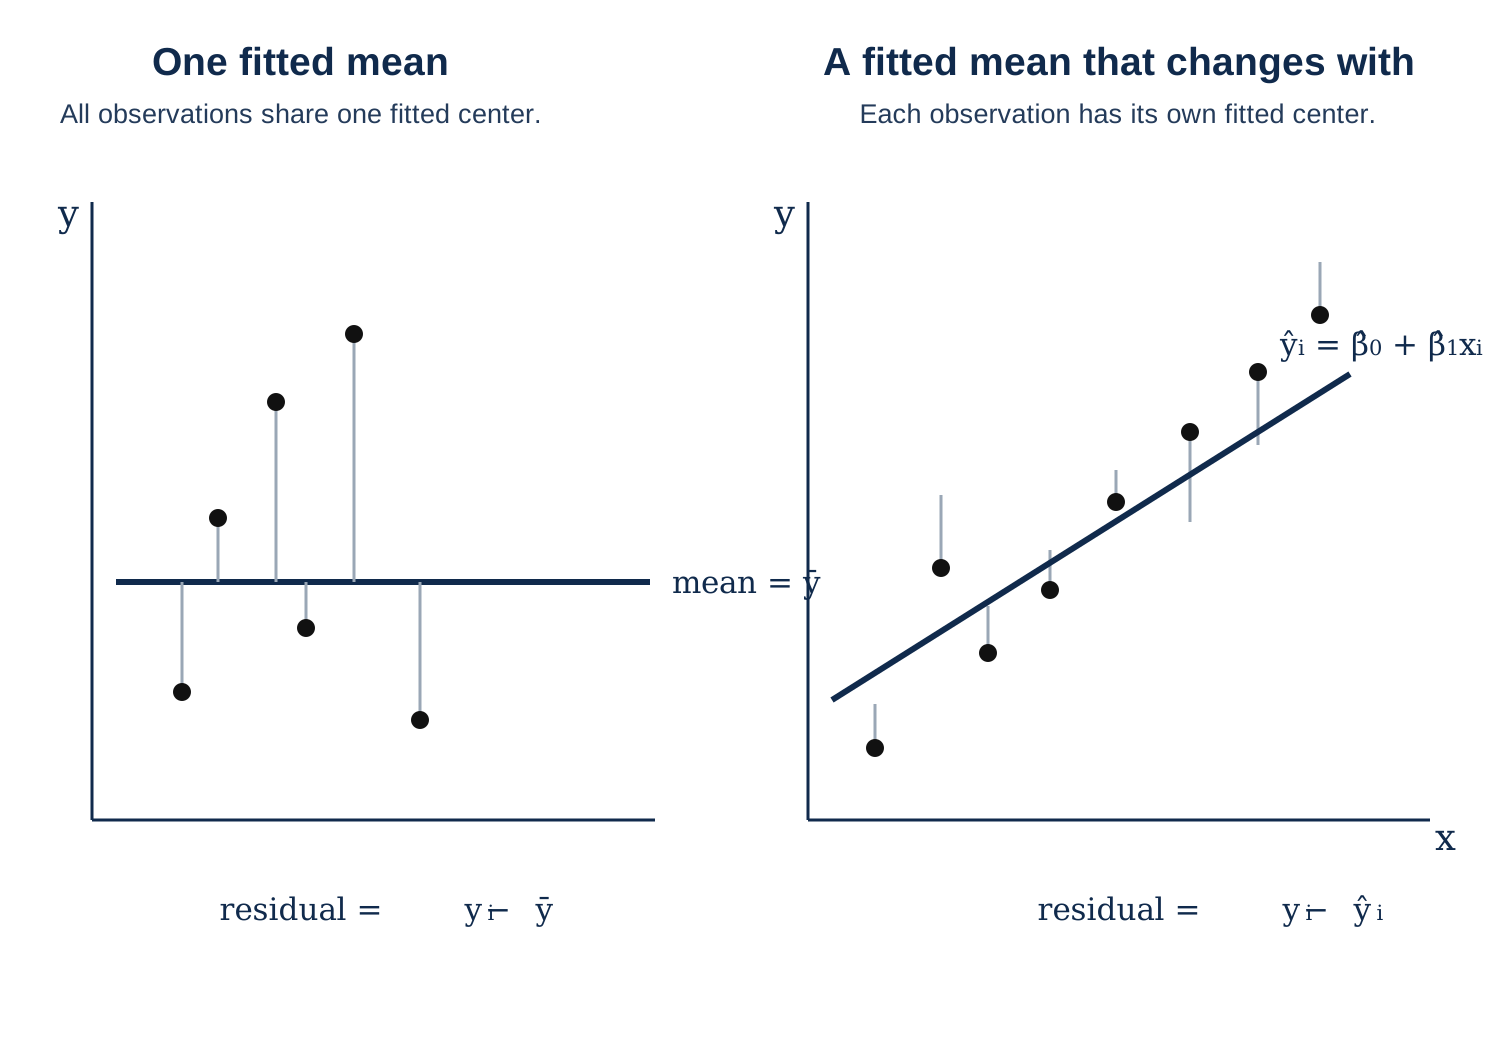
- The difference between the Confidence Interval (CI) and the Prediction Interval (PI)
- Another way to interpret the coefficient $\hat{\beta}$ in the model
- Proving that $\mathrm{SampCor}(x,y)=\sqrt{R^2}$ in simple linear regression
If you are interested, you can read this Tutorial 3 extension note.
Tutorial 4: Extension
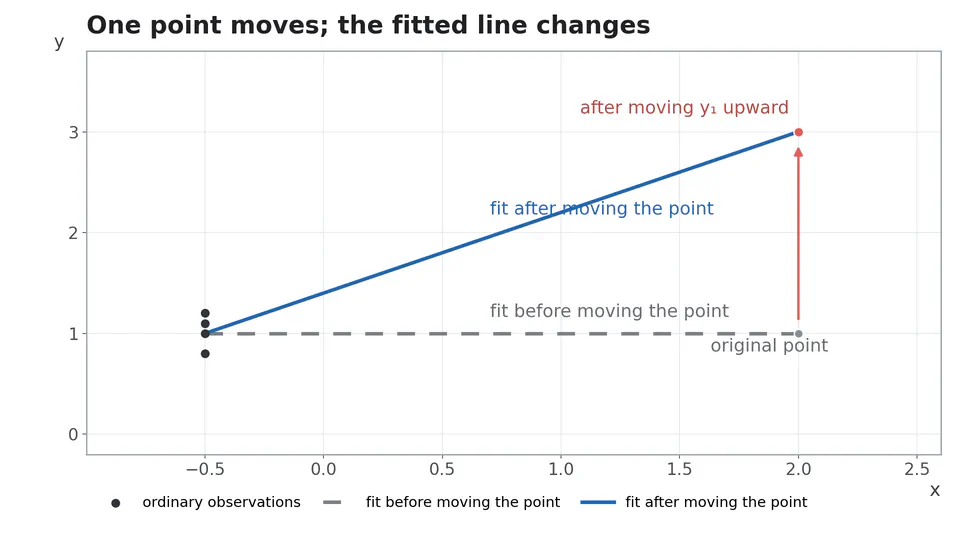
Why do we call the diagonal entries of the hat matrix leverage values, and why do they matter when we analyse residuals? The article below builds the intuition step by step using simple linear regression.
Tutorial 6: Model Assumptions
- What regression model assumptions mean
- How to deal with possible violations in practice
In this note, we use a dataset as a concrete example to show how these assumptions can be checked.
Tutorial 7 & 8: Multicollinearity
Multicollinearity can create difficulties in computation, whether in R or Python.
- These Tutorial 7 slides introduce what multicollinearity is and why it causes trouble.
- These Tutorial 8 slides introduce how to detect multicollinearity and some common remedies.
Tutorial 10: Logistic Regression
Linear regression (SLR/MLR) is used when the response variable $y$ is continuous. But what should we use when facing a classification problem, for example when $y$ takes only two values such as male/female?
A natural extension is logistic regression. These Tutorial 10 slides give a quick introduction to the model, including how to fit it, perform hypothesis testing, and make predictions.
Optional Extension
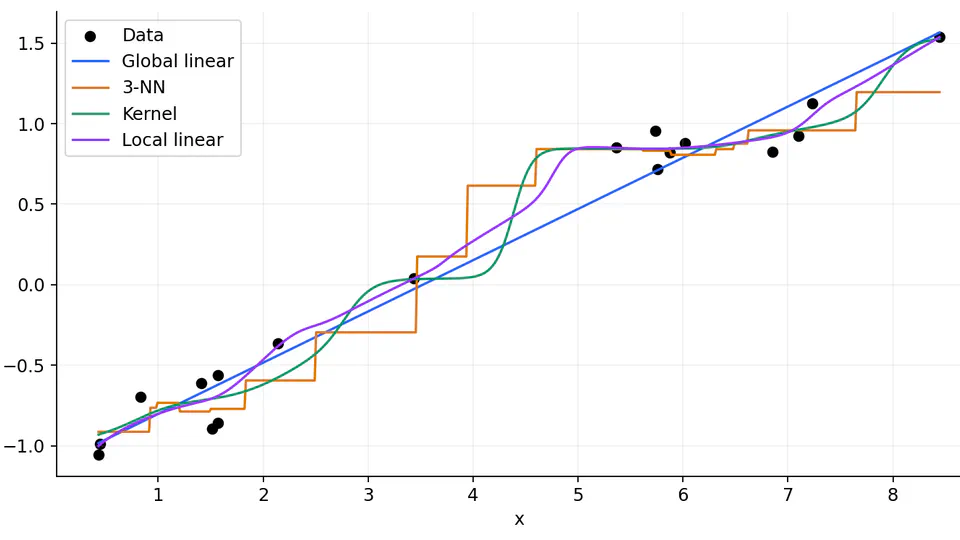
How can we fit a curve by looking at one neighbourhood at a time? This optional article connects kernel smoothing and a centred Taylor expansion to the weighted least squares ideas from regression.